Heat and hustle: likely a fast Western States 100 this year.
by: Marshall.
Editor's note: this is the running-nerd corner of the lab blog again. Normal climate-and-economics programming will resume shortly. I make no apologies.
Every June I distract myself with a little data project: can we predict winning times in this year's Western States 100 — the oldest and one of the consistently most stacked 100-mile trail races in the world? It's run in our backyard (sort of), from Olympic Valley to Auburn through California's Sierra Nevada. I do this partly because I love the race and partly because it's a clean little forecasting problem. Finishing times at Western States are driven substantially by two things you can actually measure ahead of time. One is how good the field is, which has been improving relentlessly for years. The other is the weather — specifically, how hot it gets in the canyons. And this year, the field is EXTRA stacked, AND the weather is actually cooperating: forecast high in Auburn on Saturday is currently 81°F, which sits at about the 10th percentile of race-day highs since 1985. Saturday could see some extremely fast times.
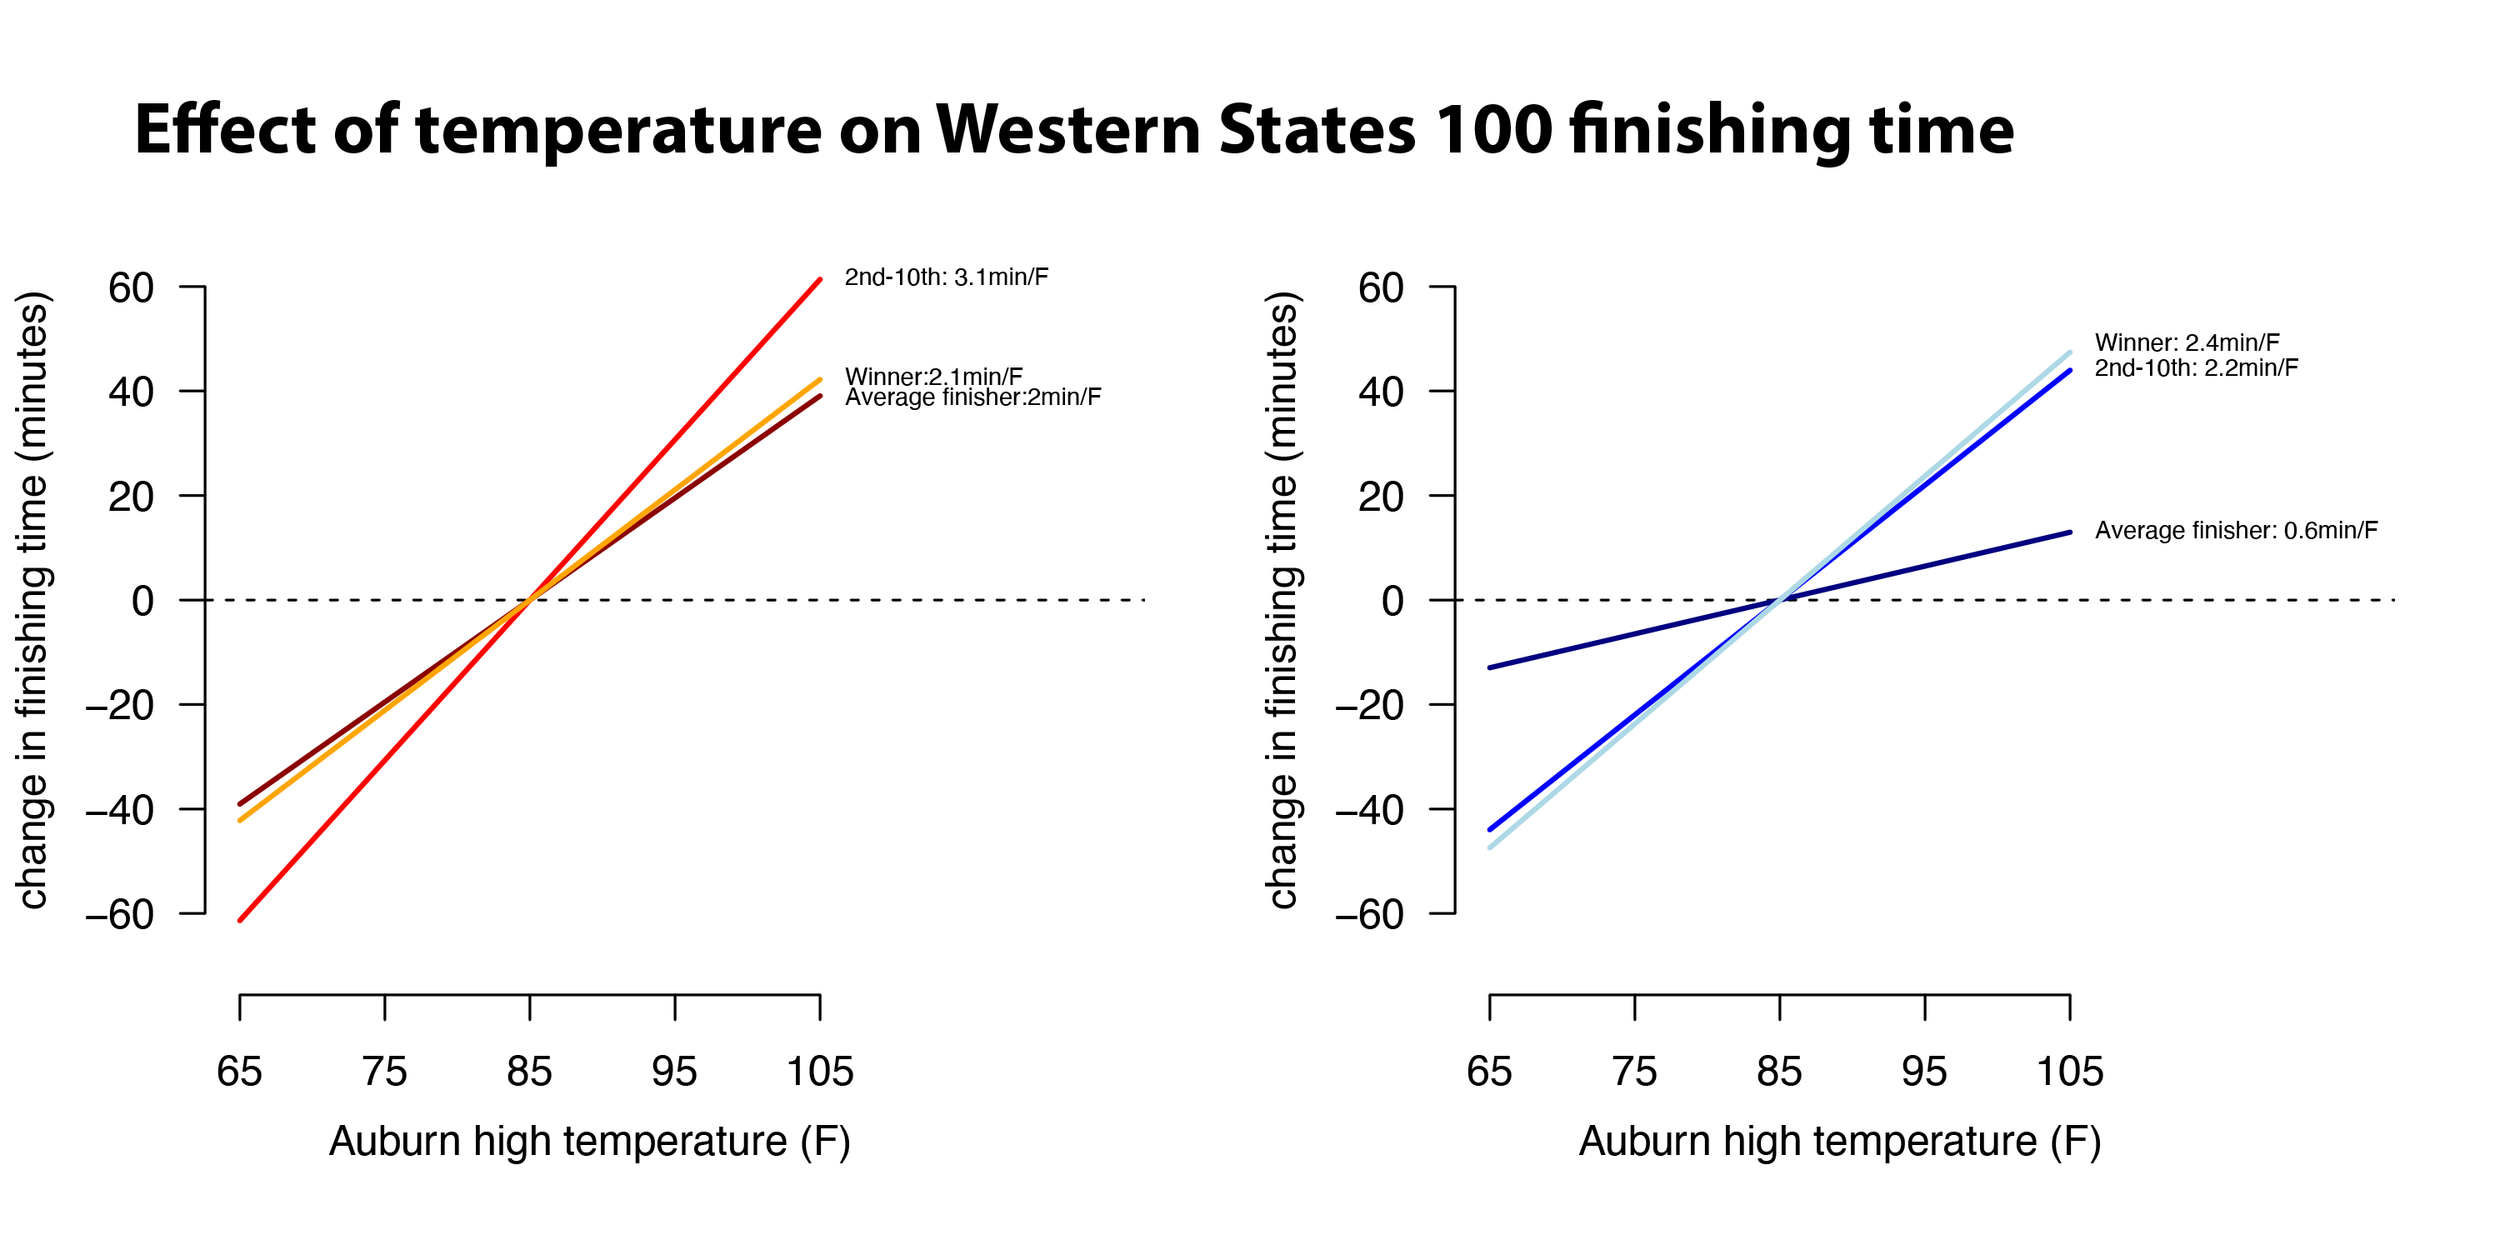
Heat is the great slowing force
If you regress finishing times against race-day temperature, the relationship is really strong: roughly 2 to 3 minutes slower finishing times per degree Fahrenheit for the front of the field, and even more for everyone behind them. Same effect for women and men.
As an example, last year Caleb Olson won in 14:11 — the second-fastest time in race history — and he did it in 95°F heat. Run that exact same effort in this year's forecast 81°F, and the temperature model says he'd have been roughly half an hour faster.
Related: Pat Baylis at UBC has a cool recent working paper that scraped data from a ton of marathons and trail ultras, and studied the effects of temperature on performance. He also sees large effects of race day heat on performance. Maybe more interesting, he shows that the amount of training you did in heat in the months prior to the race has a meaningful impact on your race-day performance, both if the day is hot and if its not. A lot of the GOATs that are running this year have been Strava-dark (Jim, Kilian) but you can bet they are sweating it out somewhere.
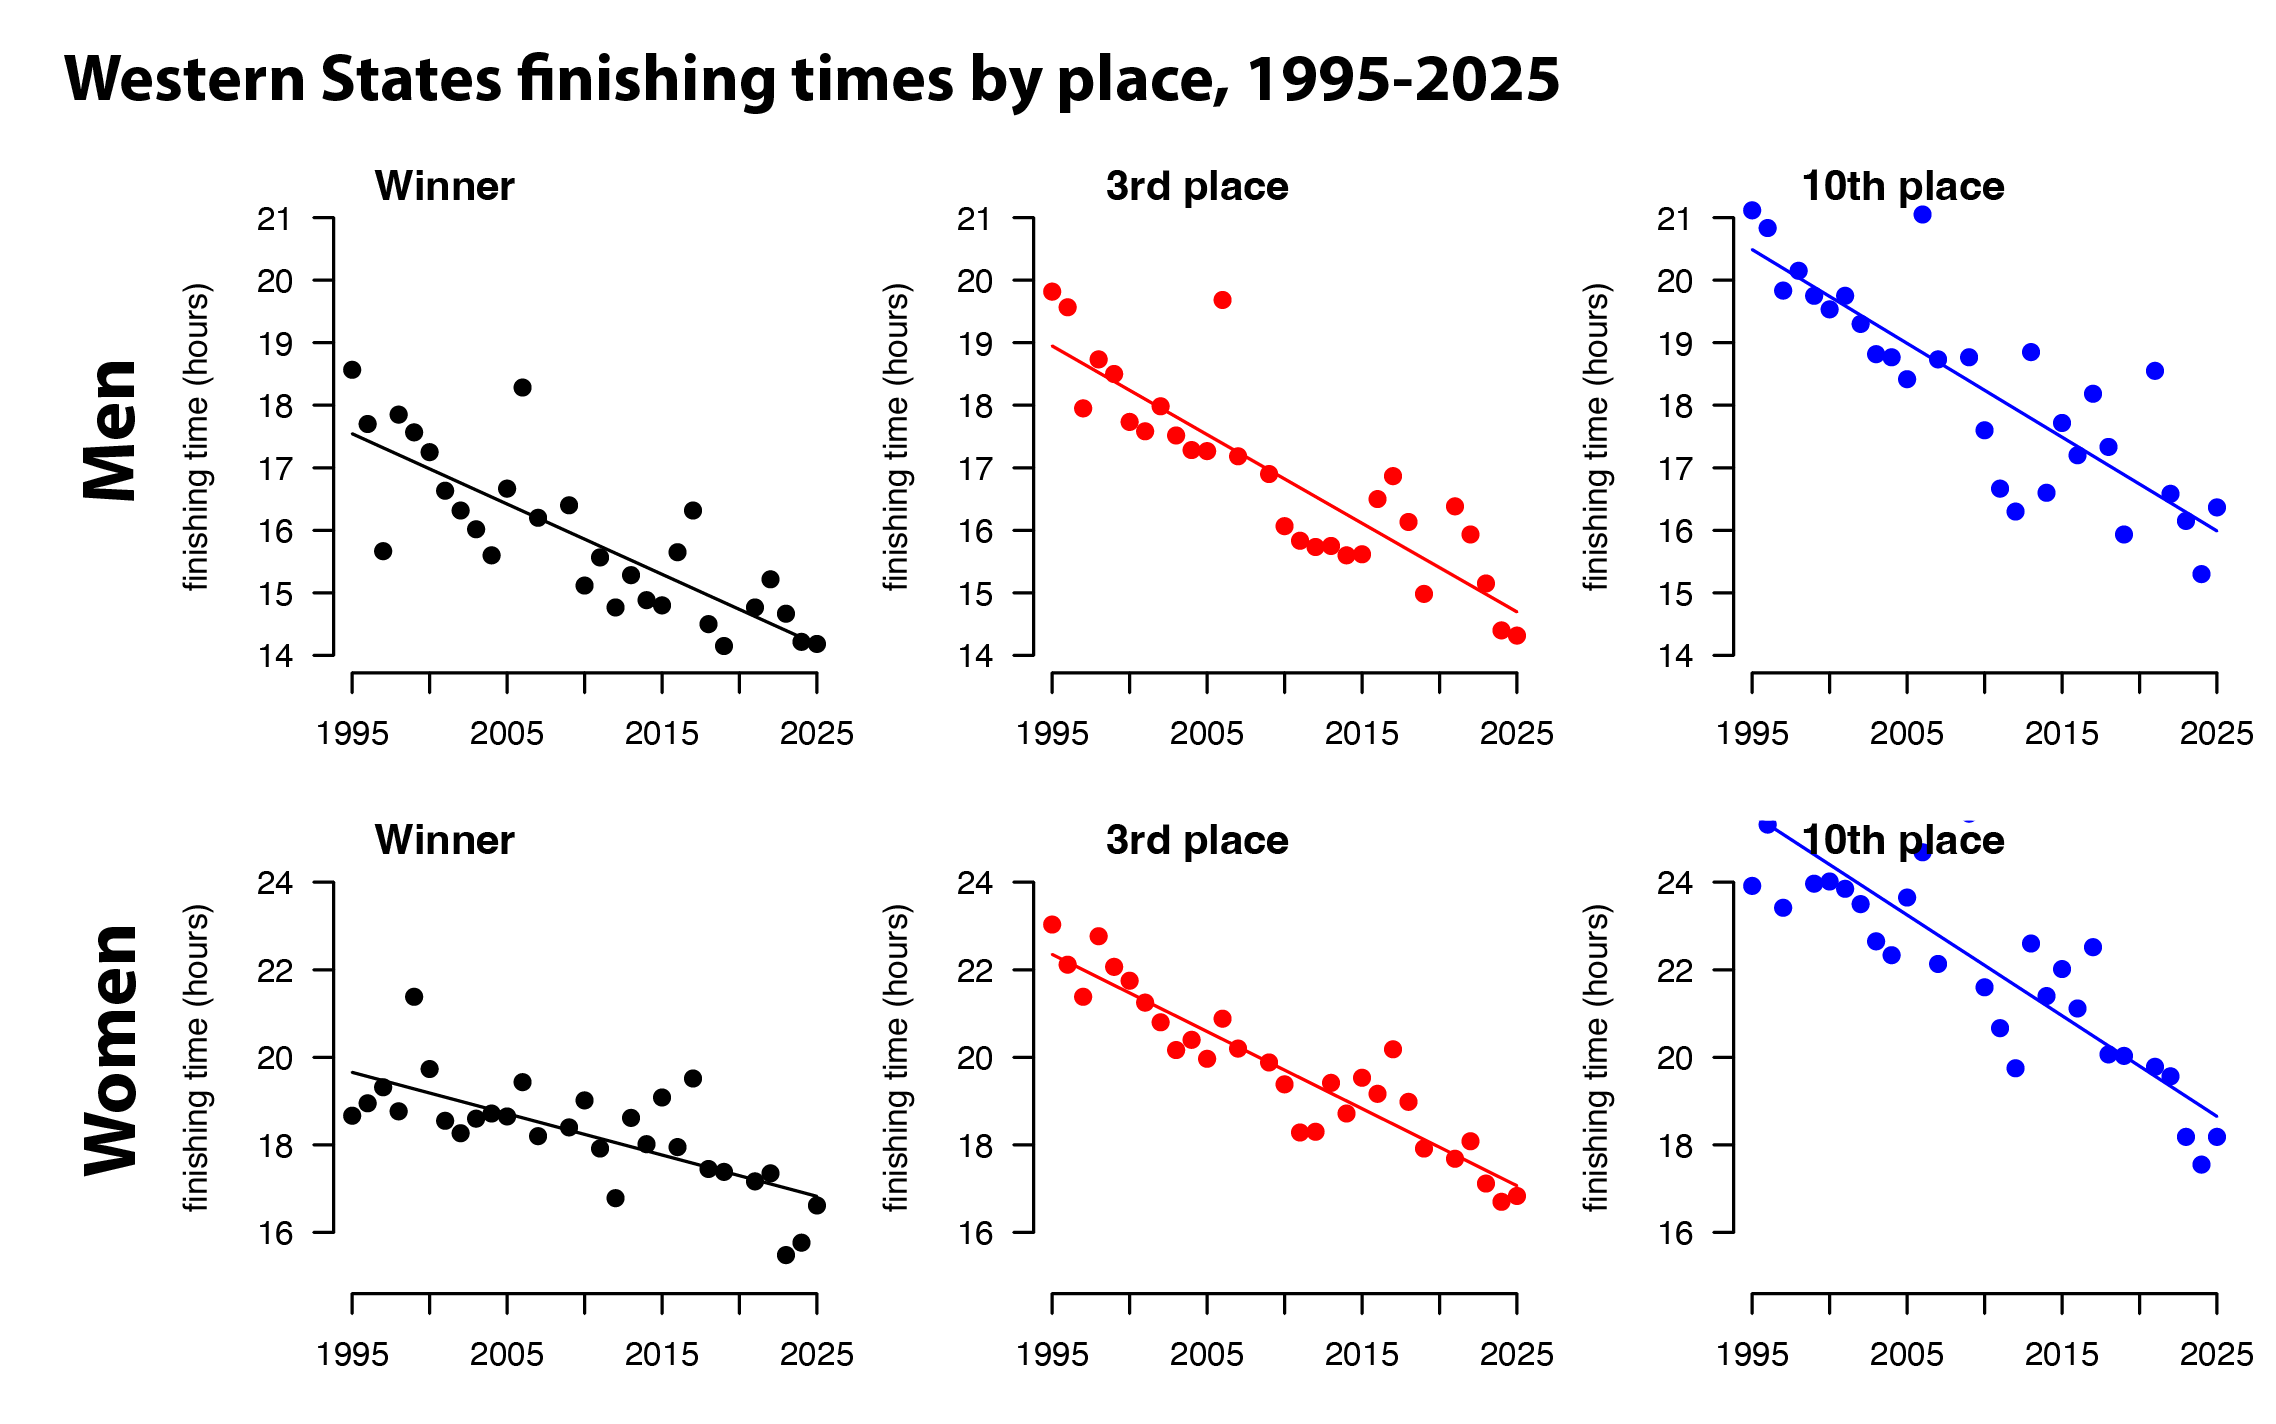
The sport keeps getting faster
Temperature explains wobbles around a longer term trend of winning times that have geen falling for decades — for the men, on the order of 7 minutes a year over the last thirty years, though the pace of improvement has perhaps slowed every so slightly in recent years. For the women, the times are falling faster, and — interestingly — they don't yet show the same flattening. More on that below.
Predictions for this year
Given the uncertainty in historical trends due to short time series and some outliers (Walmsley for the men, Courtney/Katie for the women), this year I fit a few models, all of which control for race-day temperature and the year-over-year trend but that fit the trend component differently (linear, quadratic, piecewise-linear). Then I generated an "ensemble" prediction, or the average over the three models. But, we call it an "ensemble" because we're serious people.
Here's the forecast for this year at the forecast Auburn high of 81°F:
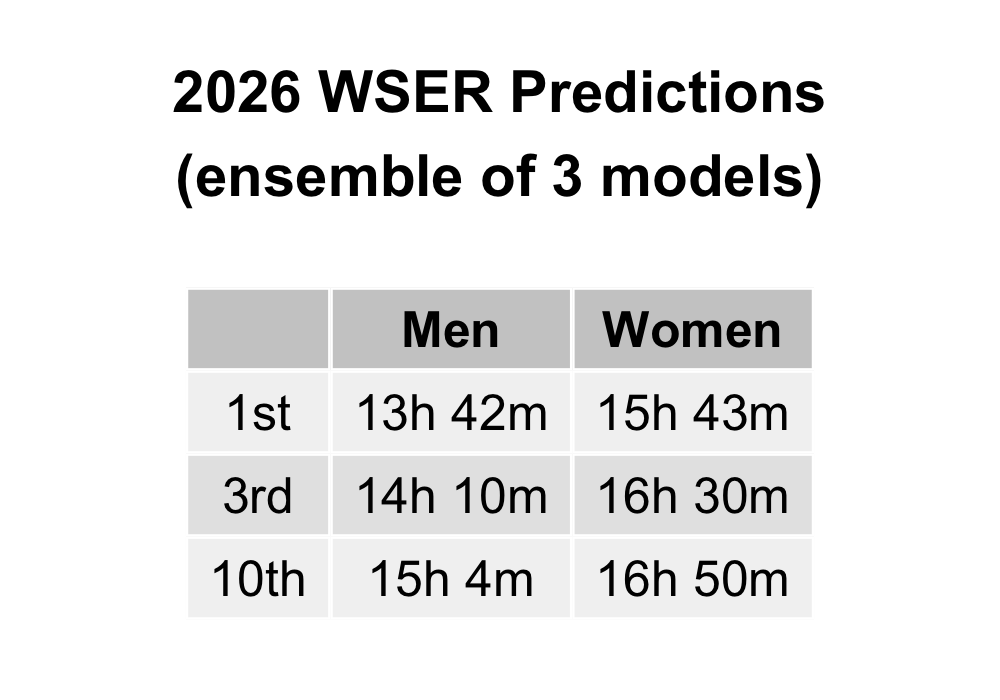
A few caveats, because these numbers are pretty aggressive. The men's winning prediction of 13:42 would be a course record by nearly half an hour. Jim Walmsley's record is 14:09:28, from 2019. The model gets there by taking a real cool-weather tailwind (recall: 2min per degree F, and this year 10-15 deg cooler than average) and stacking it on top of a long-run improvement trend. Perhaps the right way to read 13:42 is less "this is gonna happen" and more "conditions are set up for a genuine assault on the course record."
The women's 15:43 prediction is also fast, knocking on the door of Courtney's 15:29 course record (2023), which is what you'd expect a strong field to land on a cool day. But the women's field is maybe not as strong as the men's this year, with no Courtney or Katie, so this prediction could be a little hot.
The women's race is closing the gap
The women's prediction connects to what I wrote earlier this spring about gender gaps in ultrarunning. Women's times are dropping faster than the men's, and the steepest part of that decline is recent. In my models that shows up as the women's trend still accelerating downward while the men's has started to (slightly) level off. Some of this is a small-sample story (a handful of extraordinary recent performances), but the direciton is pretty clear.
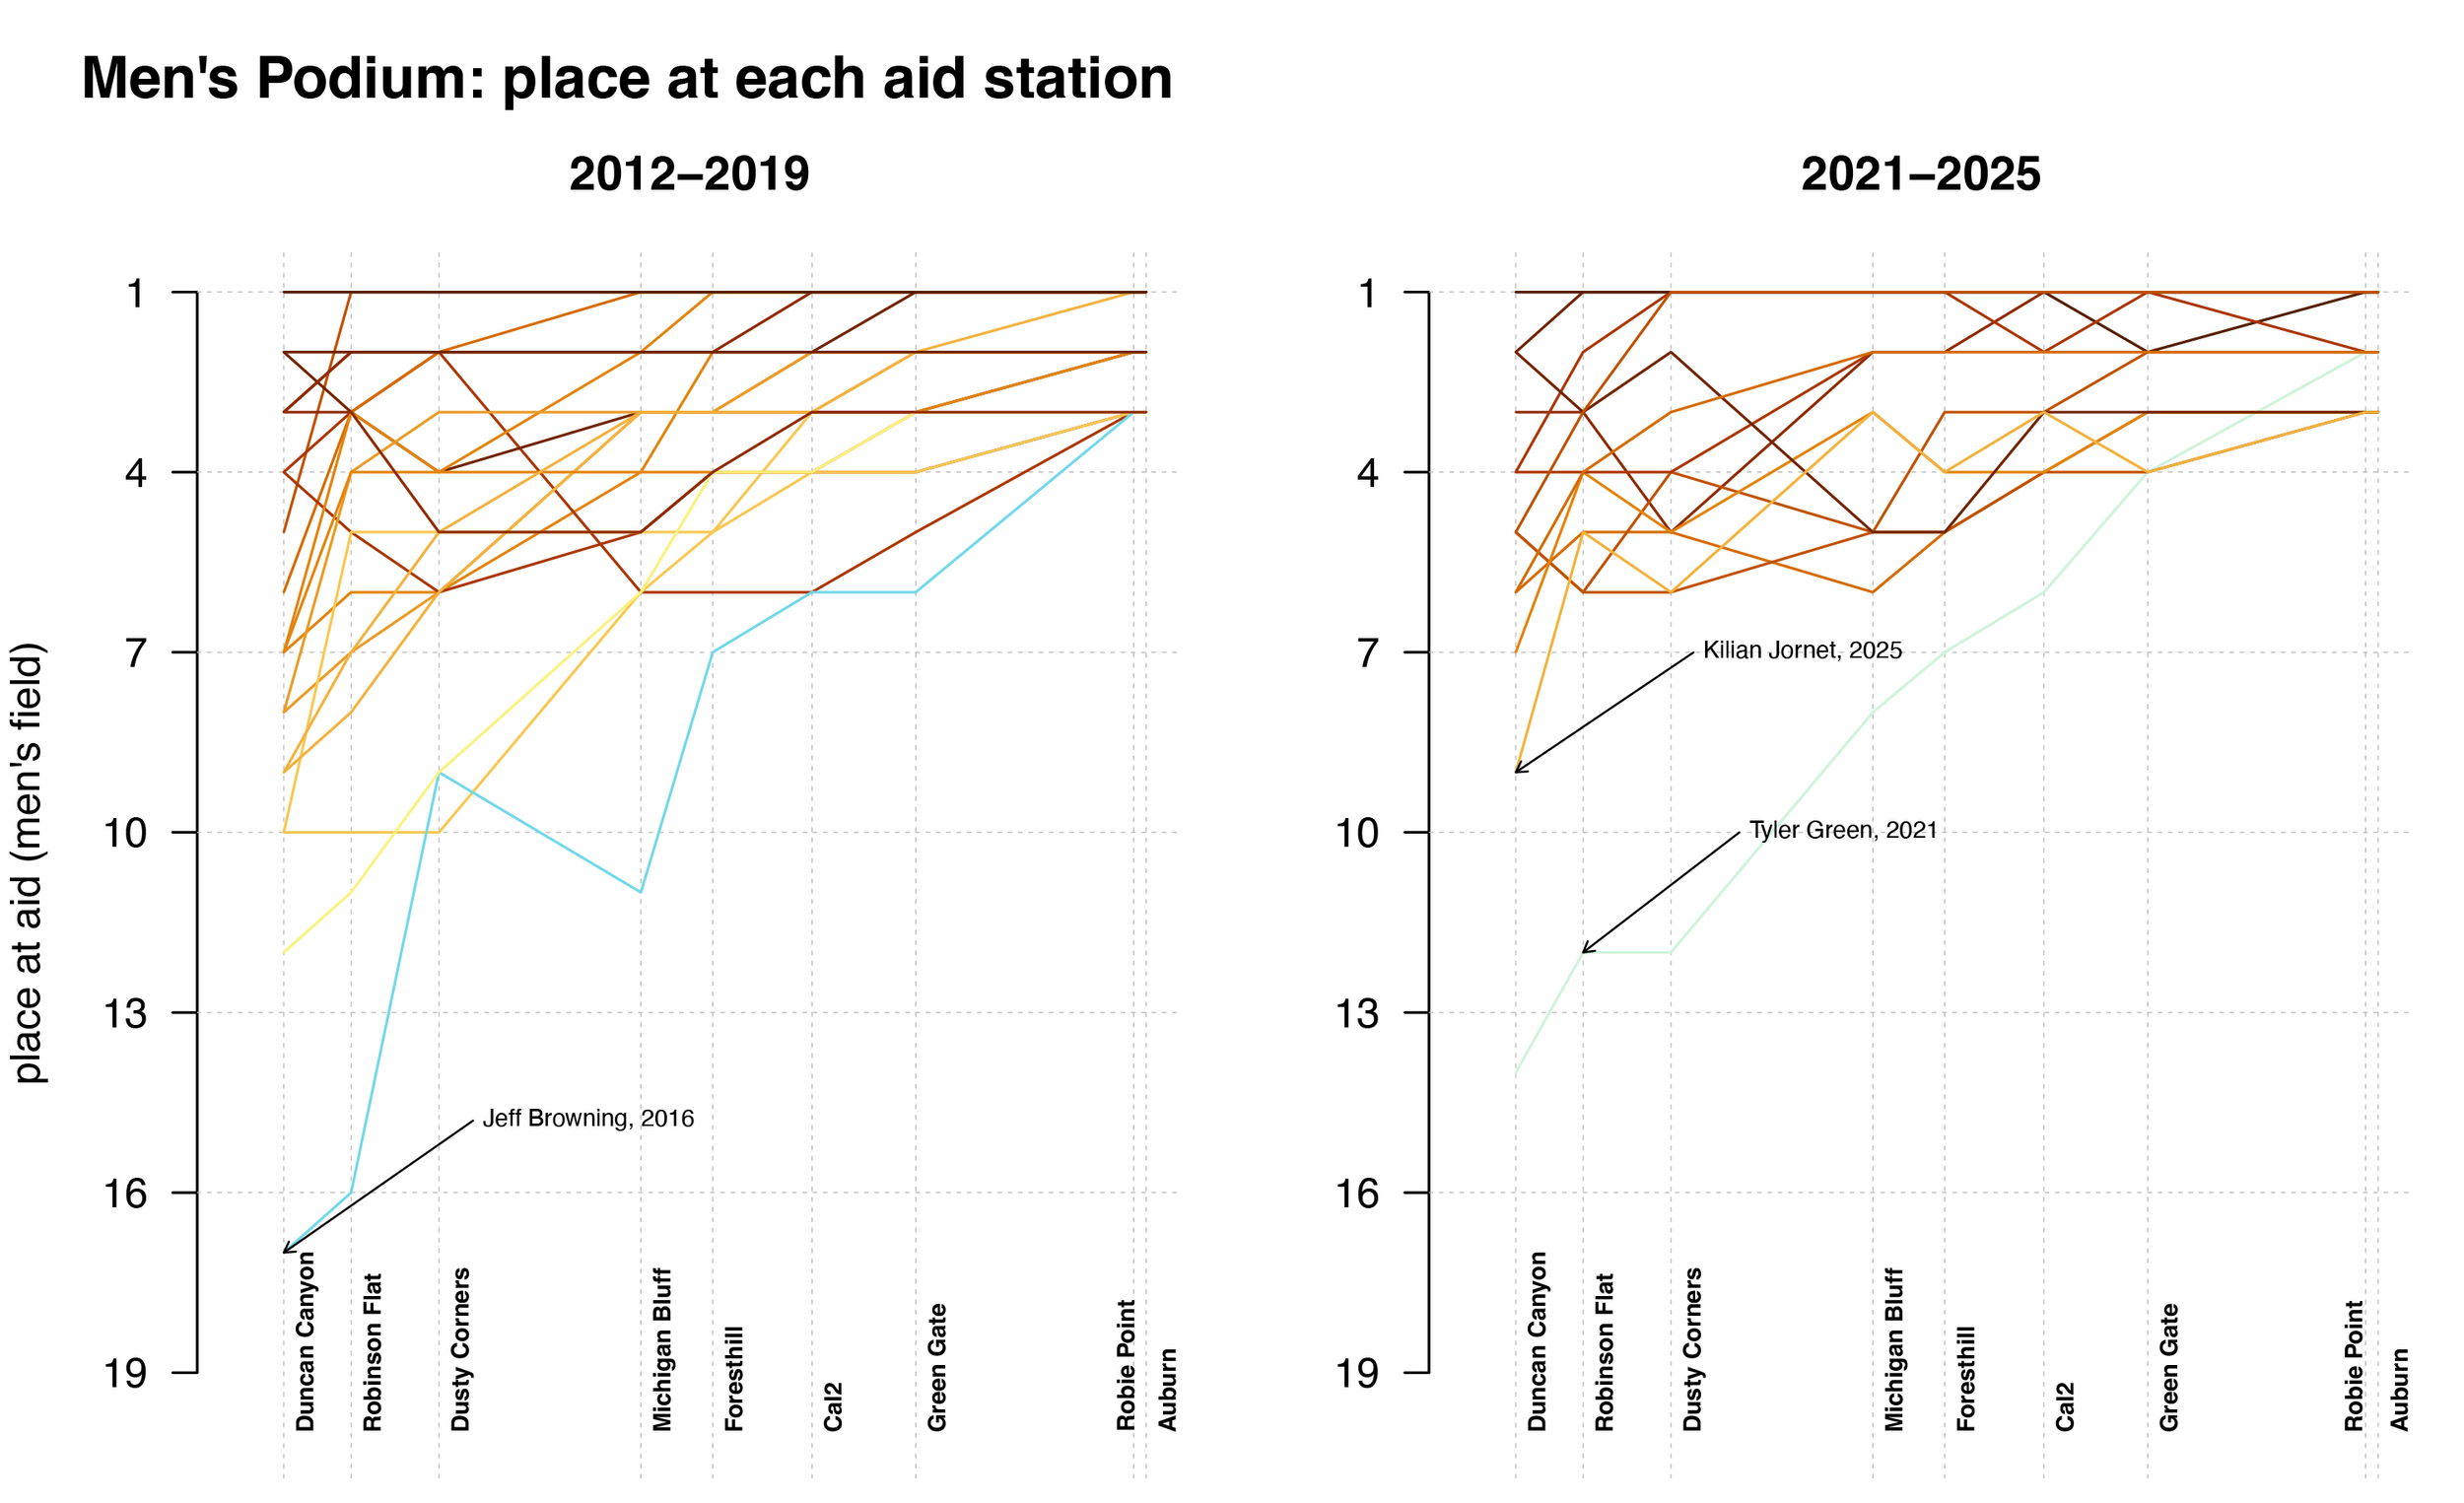
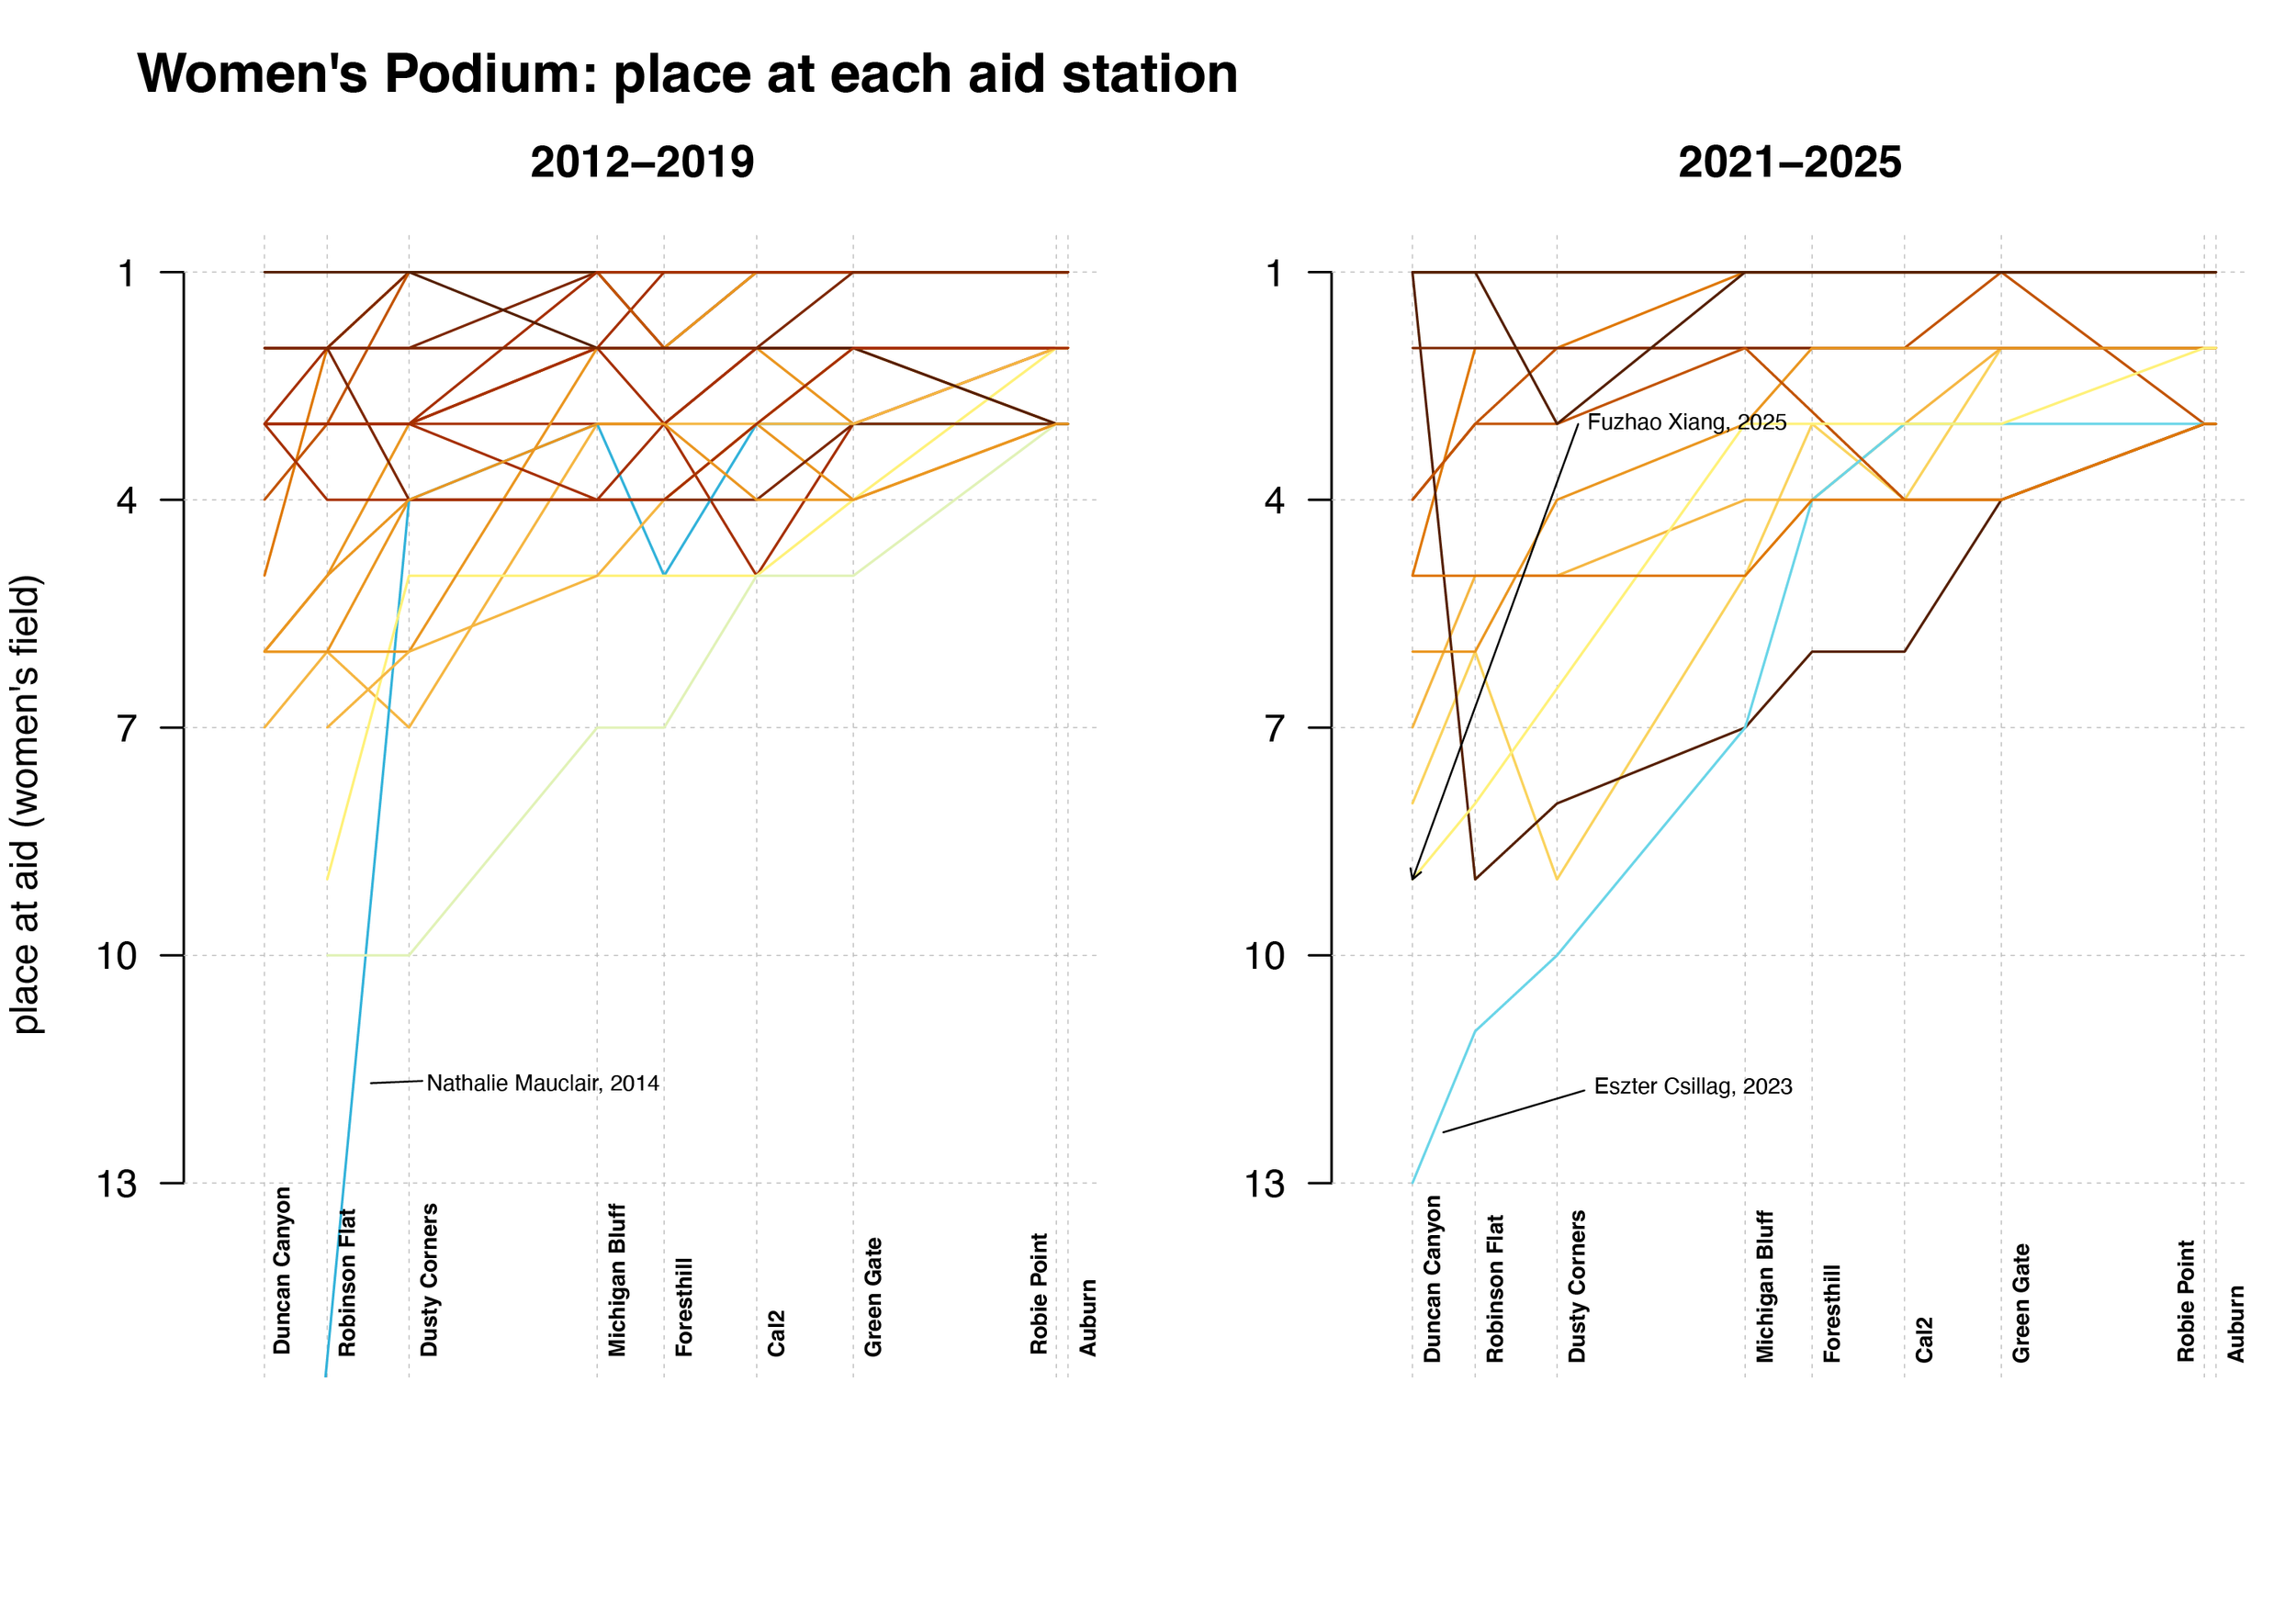
Does the race begin at Foresthill?
Even deeper nerd-dom. I haven't run WS, but the conventional wisdom is that the "race begins at Foresthill", roughly 100k in. That doesn't actually seem to be true in the data, and is less true in more recent years. Below are plots of where the men's and women’s podiums were at at key aid stations as they moved through the race. I split this into some earlier years and then most recent years to see if it had changed much over time. If anything the story is even stronger in more recent years: if you're not in about the top 5 at Foresthill, you are off the podium. So it's more like, "the race is mostly over at Foresthill". There is more variation earlier in the race - Tyler Green was well outside the top-10 at mile 24 in 2021, Kilian barely inside the top 10 at the same spot, Esther Csillag ditto - but places are pretty solidified by Foresthill.